CONFIDENTIAL — internal analytics. Unlisted; please do not share or index.
Civitar · Analytics & Impact · as of Aug 2026
The public record on America's data-center buildout — in plain language, and modeled.
Civitar is a free, neutral, fully-cited platform: an environmental briefing on every U.S. data center — water, air, noise, endangered species, grid, and environmental justice — plus original national modeling of where the buildout is going and what it costs. This page summarizes traction and the science for reviewers.
1,880U.S. data centers mapped (1,543 built · 337 proposed)
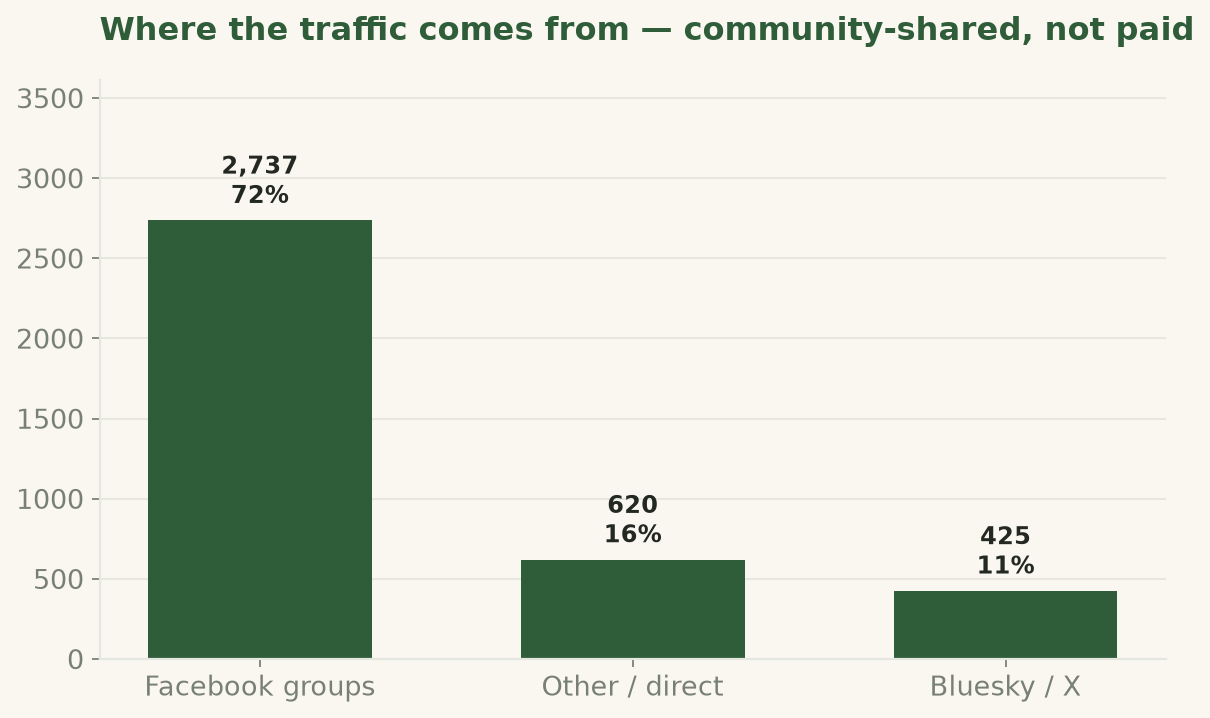
3,771tracked community shares · 147 campaigns · zero paid
45founding members · 80% sign-in conversion
#1grid access is the dominant driver of where data centers get built — far above environmental cost (4-model consensus)
01 — Traction · arms-length, community-driven
Grassroots demand, not paid acquisition
Civitar's growth has been carried almost entirely by the communities it serves — organically shared into local anti-data-center Facebook groups, with zero paid acquisition. Every outbound link is tracked, so the demand is attributable by campaign and channel.
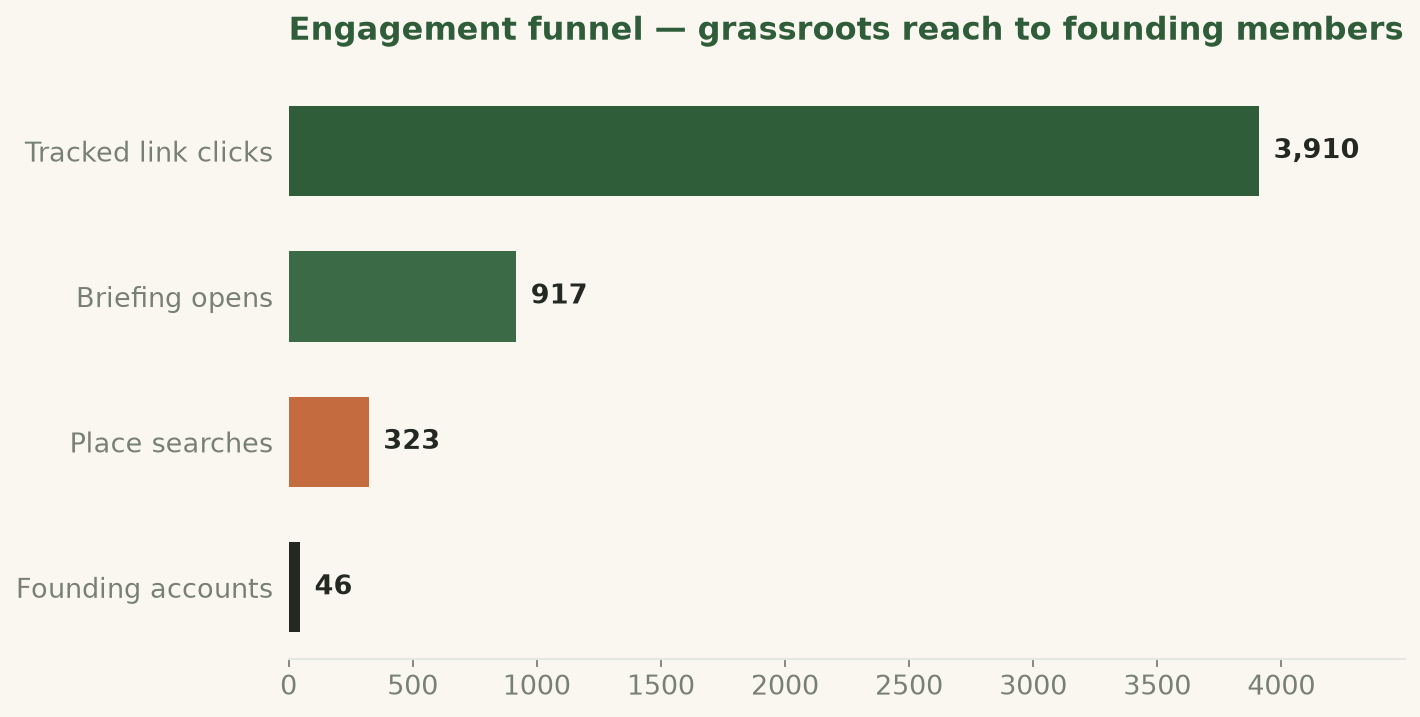
The funnel. ~3,771 tracked link clicks → 854 briefing opens → 315 place searches → 45 founding accounts, since attribution logging began.Community-shared. Sign-ups arrive predominantly through tracked links shared into Facebook community groups (the “FB groups” bar) — the arms-length signal, with zero paid acquisition.
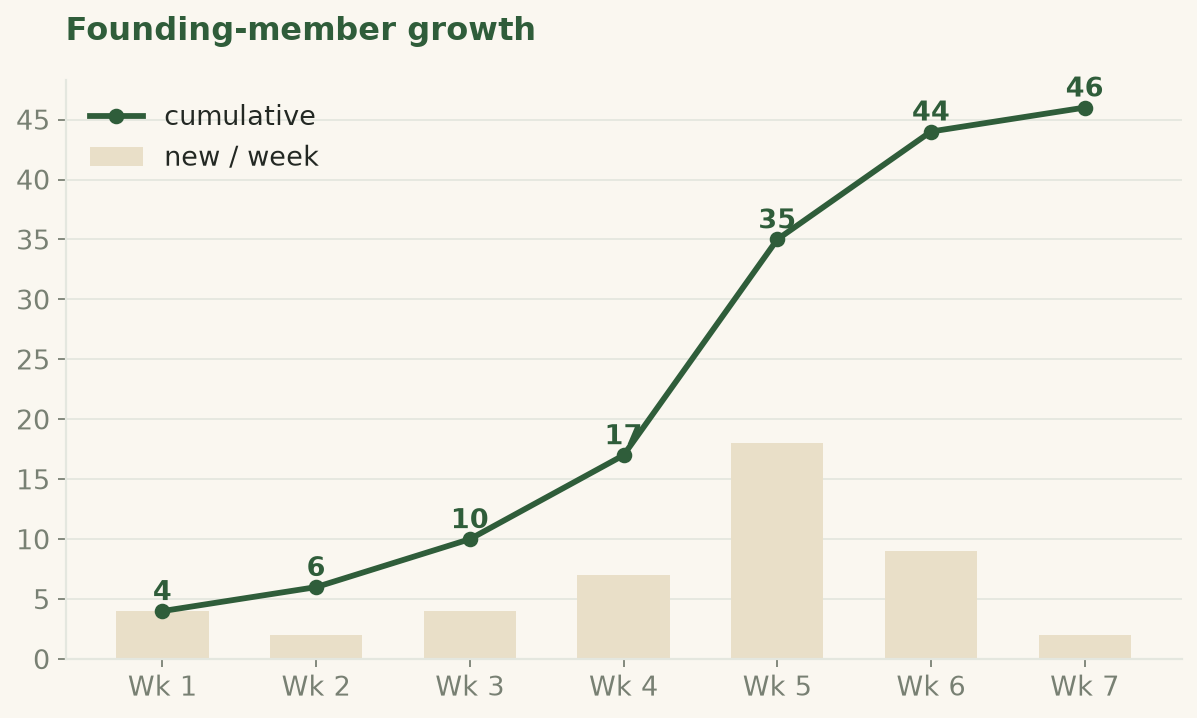
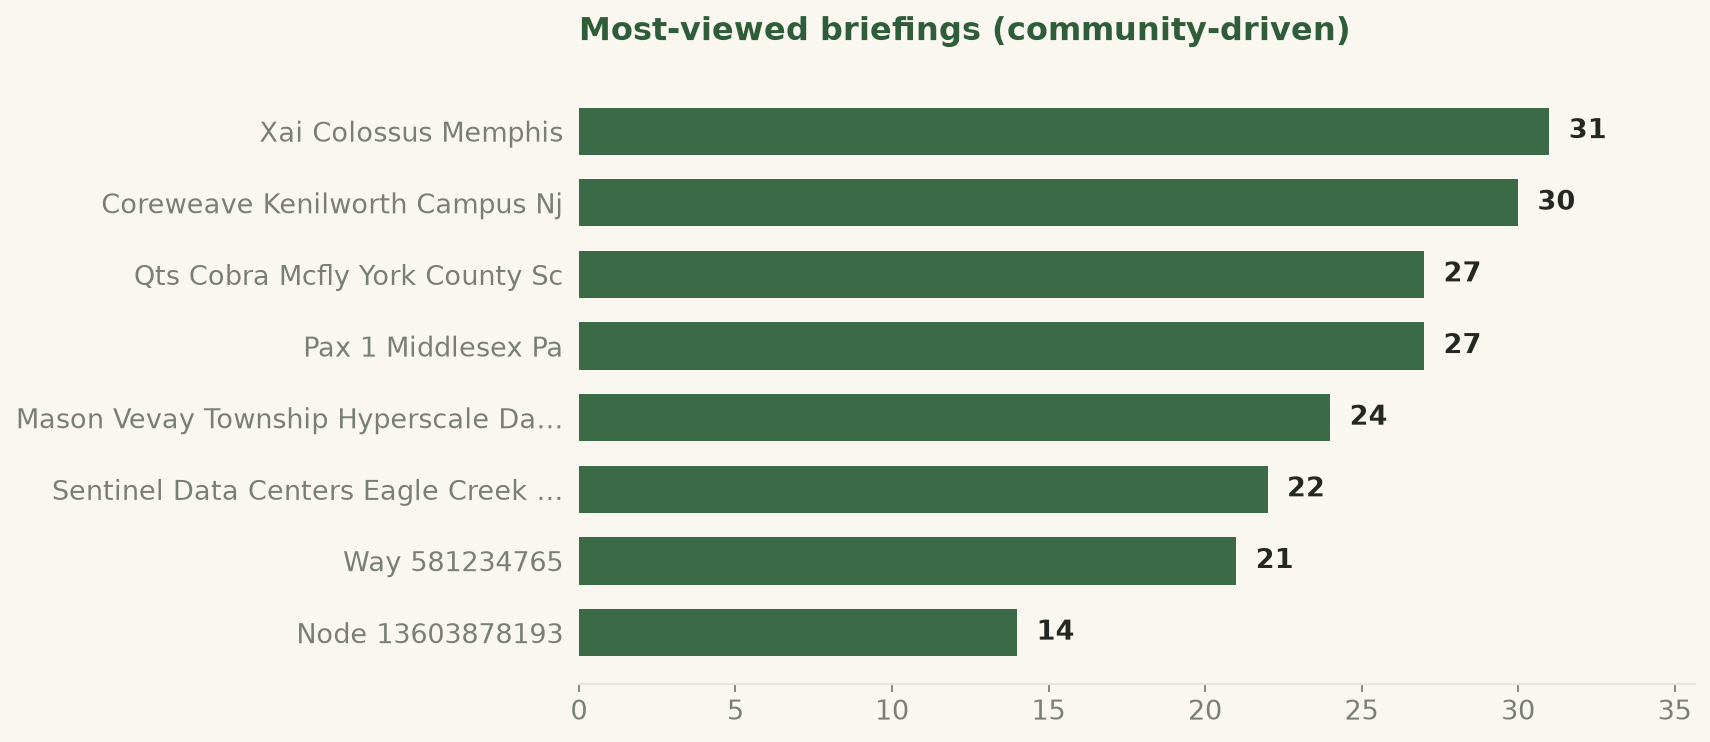
Founding members. A launch cohort, a lull, then re-acceleration tracking the community traffic — at a healthy 76% sign-in conversion.Community-driven interest. The most-viewed briefings are community-submitted sites — the submit → briefing → share loop working.
Why it matters: real communities are adopting and re-sharing Civitar without prompting or spend — the clearest arms-length evidence of product-market fit for a public-interest tool.
02 — The science · national siting & cumulative-impact model
Where the buildout is going — and what it costs
Beyond per-site briefings, Civitar runs an original, CONUS-wide model of the data-center buildout. All layers are rasterized to a shared 5-km grid (USGS Albers, EPSG:5070), with areal covariates summarized within a 50-mile focal radius. methods summarized
What actually drives where data centers are built?
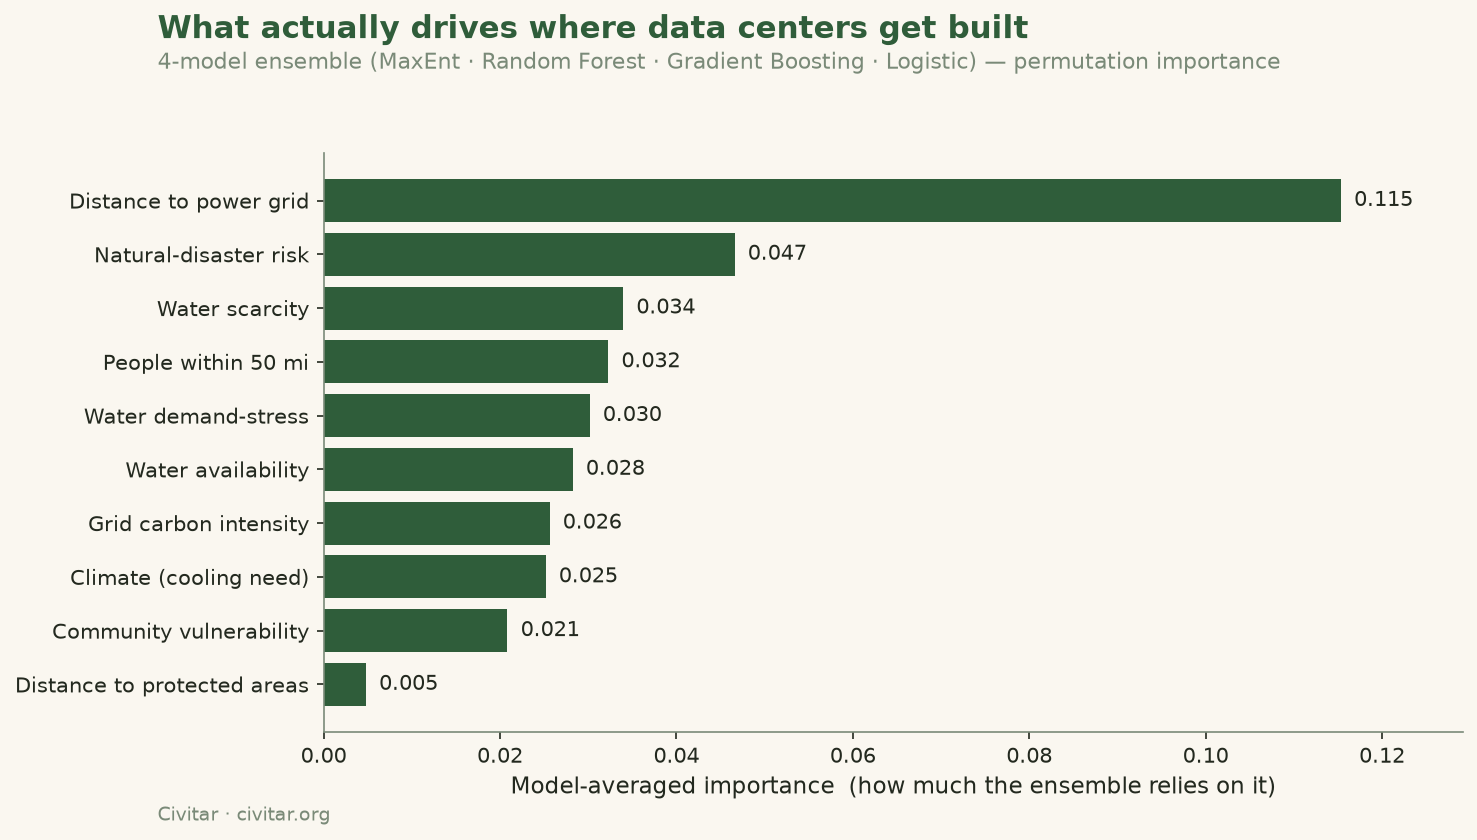
We fit an ensemble of four models (MaxEnt, Random Forest, Gradient Boosting, regularized logistic GLM) on 1,531 existing U.S. data centers vs. 12,000 background points, then rank each covariate by model-averaged permutation importance. Performance is reported under honest spatial block cross-validation (AUC ≈ 0.79) — not the optimistic ~0.96 that clustered resampling inflates.
Siting is governed first by grid feasibility. Distance to the power grid dominates (0.115), followed by natural-disaster risk, water scarcity, and proximity to population — environmental costs sit in the middle of the pack.
Core finding: where data centers get built is driven first and foremost by grid access — distance to transmission outweighs every other factor by a wide margin. Environmental costs — water scarcity, grid carbon, and community vulnerability — sit in the middle of the pack: they shape siting modestly, but they are not what the buildout optimizes for.
Cumulative harm — the impact surface
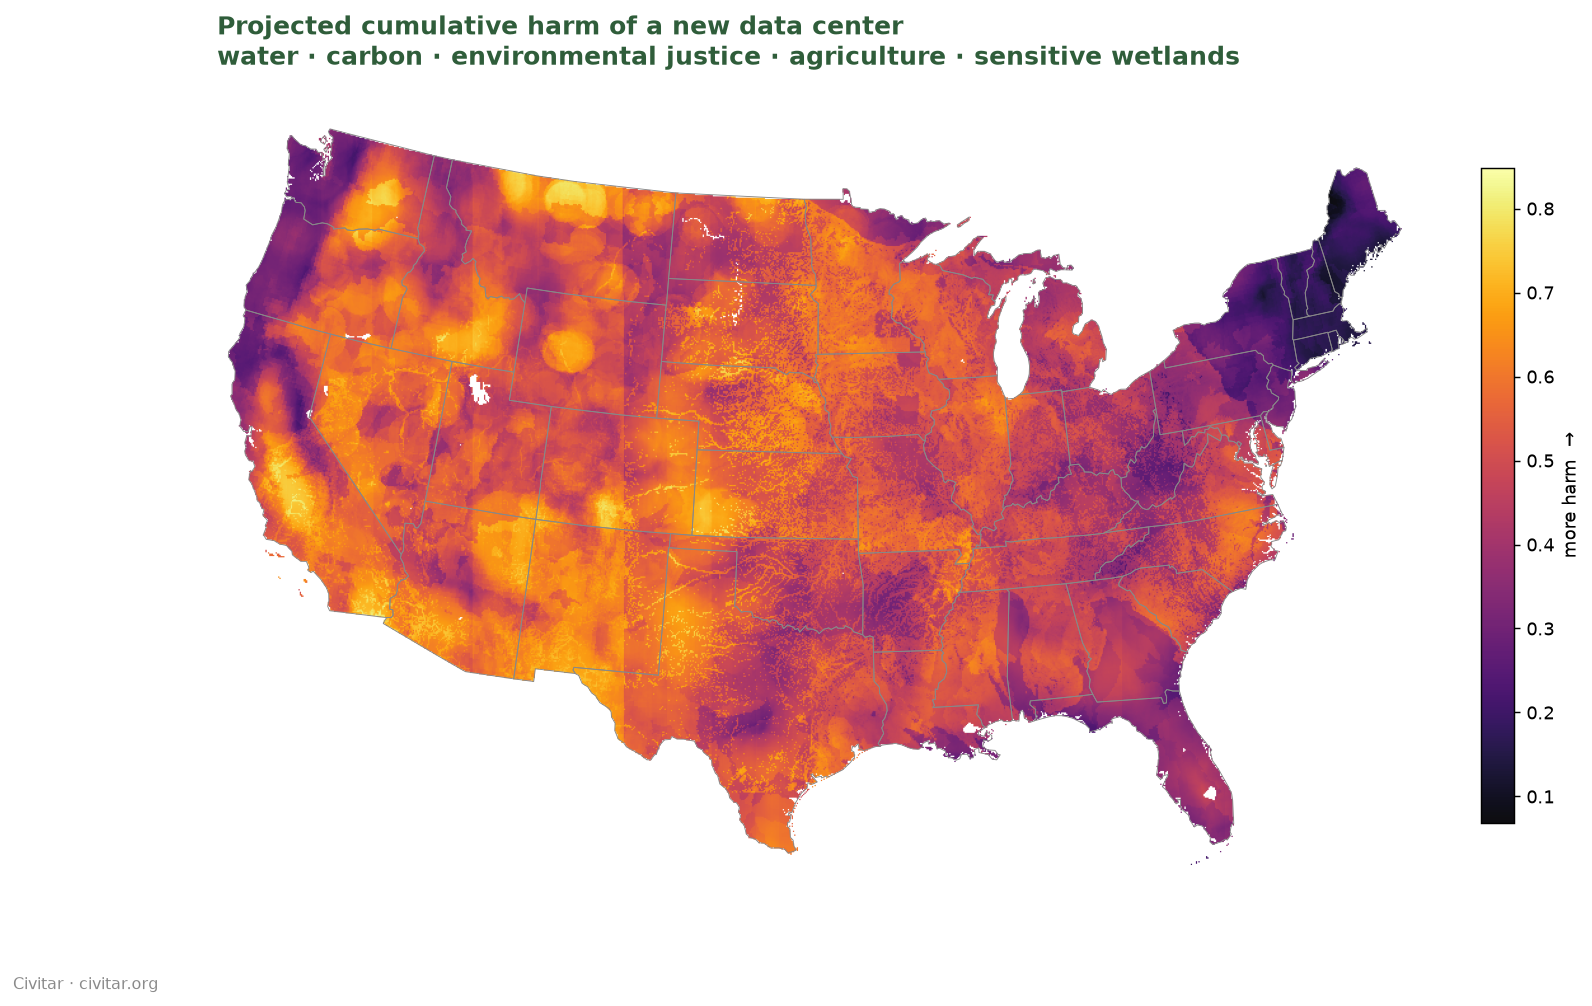
For every cell we compute a rank-normalized cumulative-harm index — an equal-footing blend of five costs: water scarcity, grid carbon, environmental-justice burden, prime agricultural land, and sensitive wetlands (USFWS National Wetlands Inventory, filtered to estuarine/marine and forested/scrub-shrub types). Rank-normalizing each term keeps any one from dominating by raw scale.
Projected cumulative harm of a new data center. Highest across the arid Southwest (water), the agricultural belt (cropland), and the wetland-rich Gulf, Great Lakes, and coasts — lowest through the Appalachians and interior Northeast.
Evaluating model agreement
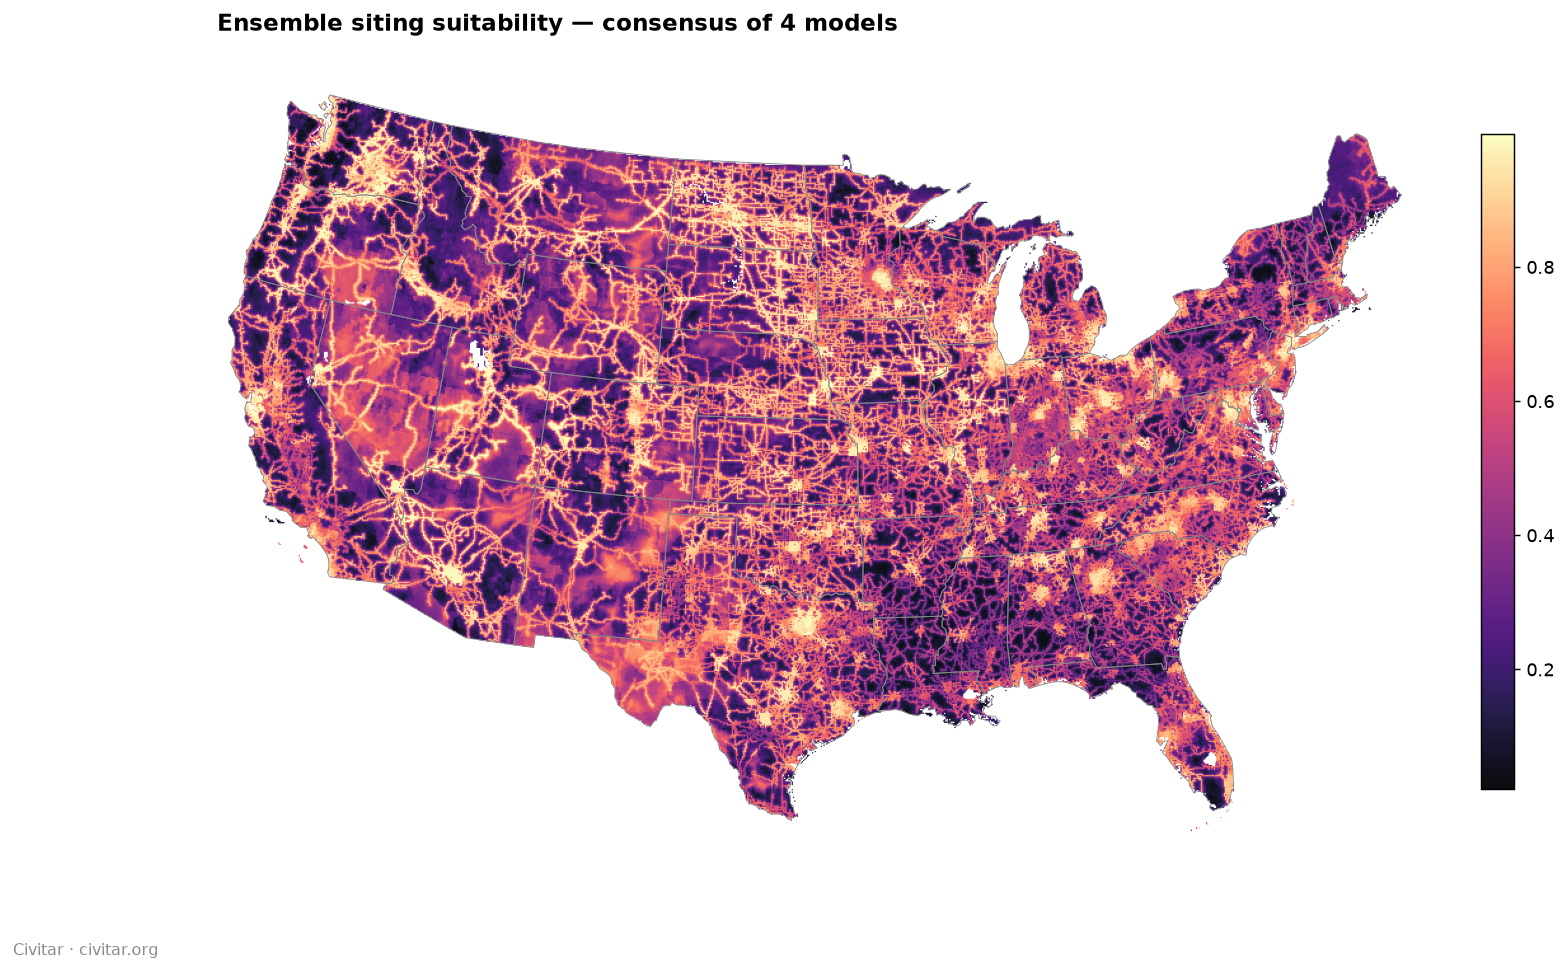
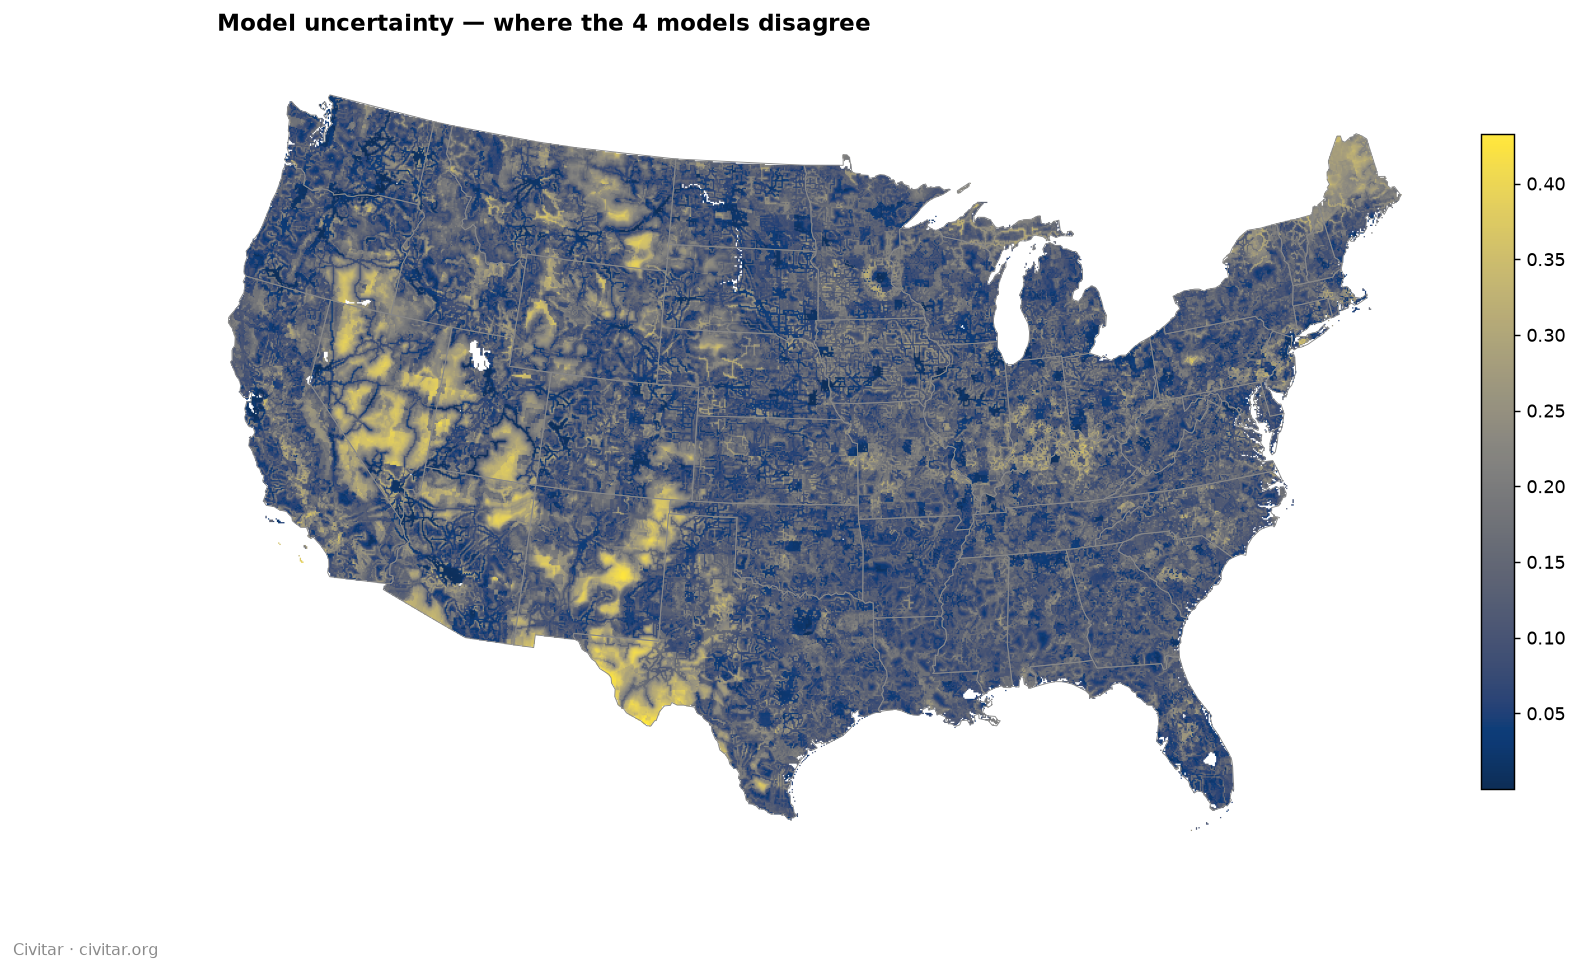
A single algorithm carries its own assumptions. So the feasibility surface is a performance-weighted consensus of four models with different inductive biases — MaxEnt, Random Forest, Gradient Boosting, and a regularized logistic GLM — each evaluated under spatial block cross-validation (honest performance given the sites cluster). All four converge at AUC ≈ 0.79 under spatial CV, and no single method's bias dominates. The disagreement between models becomes an uncertainty map: where the signal is robust versus model-dependent.
Consensus of four models. A performance-weighted mean across MaxEnt, Random Forest, Gradient Boosting, and a logistic GLM — the feasibility surface the mitigation map is built on, so no one algorithm's bias drives the recommendation.Where the models disagree. Among-model spread — shown, not hidden. The recommendation is strongest where all four agree; high-uncertainty areas warrant caution.
Why it matters: the siting model is a consensus of four independent methods, cross-validated spatially, with its uncertainty published — not a single confident surface. That's what makes the "where to build to reduce harm" claim defensible.
Where to build instead — the mitigation surface
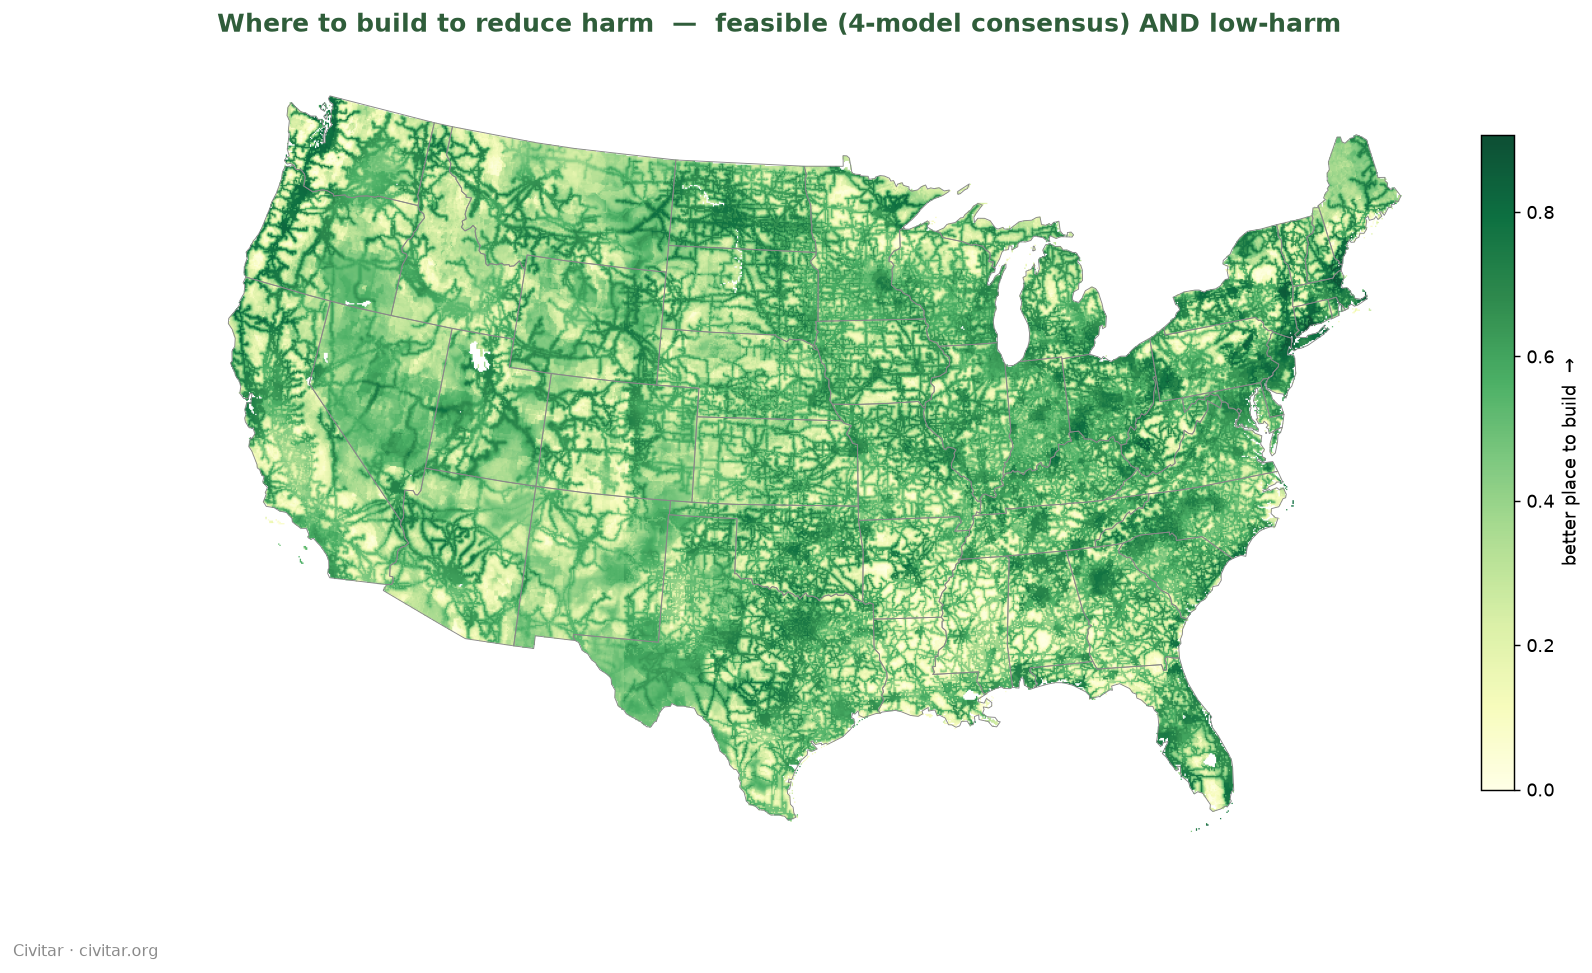
Crossing the consensus feasibility with cumulative harm yields the mitigation surface — locations both feasible to build and low on projected harm (water scarcity, grid carbon, environmental-justice burden, prime agricultural land, and sensitive wetlands).
Where to build to reduce harm. The 4-model consensus feasibility crossed with the five-term harm surface (rank-balanced). Feasible-and-low-harm zones concentrate through the Appalachians, interior Northeast, and parts of the Upper Midwest — steering away from the arid Southwest, the cropland core, and coastal/Great-Lakes wetlands.
03 — The platform
What communities actually use
Per-site briefings
A plain-language, fully-cited environmental briefing on any U.S. data center — water, air, noise, endangered species, grid load, and EJ, each figure linked to its primary source.
The map
Every built and proposed site, searchable by town; select any and see the surrounding cluster of nearby data centers.
Change tracking
Save a site and get an email when its public record changes — new filings, updated readings, denials, nearby proposals. A dated changelog per site.
Community sourcing
Anyone can submit a data center in seconds; we build the cited briefing and add it to the map — the loop driving organic growth.
Mitigation Explorer
The national model, made interactive — suitability, cumulative impact, and where siting would reduce harm.
Neutral & free
No paywall to read, no side taken — just the public record, in plain language. Citations on every claim.
04 — Projected growth
A warm, organized, national market
Civitar's market is the fast-growing network of communities contending with the buildout. Local opposition is already organized into hundreds of anti-data-center Facebook groups nationwide — Civitar has mapped and engaged over 260 of them so far, each a warm audience that shares briefings into its own community. The policy signal is just as large: 285 counties and 31 states (in 49 of 50 states) have moved to pause or restrict data centers.
The growth engine: every new site becomes a cited briefing, which gets shared into its local group, which drives sign-ups and more submissions — a compounding, community-powered loop, not a paid-acquisition treadmill.
05 — Methods & data provenance
How it's built
Modeling. Siting feasibility is a 4-model ensemble (MaxEnt, Random Forest, Gradient Boosting, regularized logistic GLM) on a CONUS Albers 5-km grid — 1,531 existing sites as presences vs. background — evaluated by spatial block cross-validation (AUC ≈ 0.79) and combined into a performance-weighted consensus, with an among-model uncertainty layer. The mitigation surface crosses that consensus with a rank-normalized cumulative-harm objective over five terms: water scarcity, grid carbon, environmental-justice burden, agricultural land, and sensitive wetlands. detailed methods available to reviewers on request
Per-site briefings are assembled by an agentic pipeline over public data, with every figure cited to its source and grounded/verified before publication.
Primary data sources
USGS · U.S. EPA (eGRID carbon intensity, EJScreen) · U.S. Census / ACS · WRI Aqueduct (baseline water stress) · FEMA National Risk Index · USGS/MRLC NLCD land cover (agriculture) · USFWS National Wetlands Inventory (sensitive wetlands) · USFWS IPaC (endangered species) · ESA Sentinel-2 · OpenStreetMap · state PUC / utility interconnection filings · county zoning & permitting dockets.